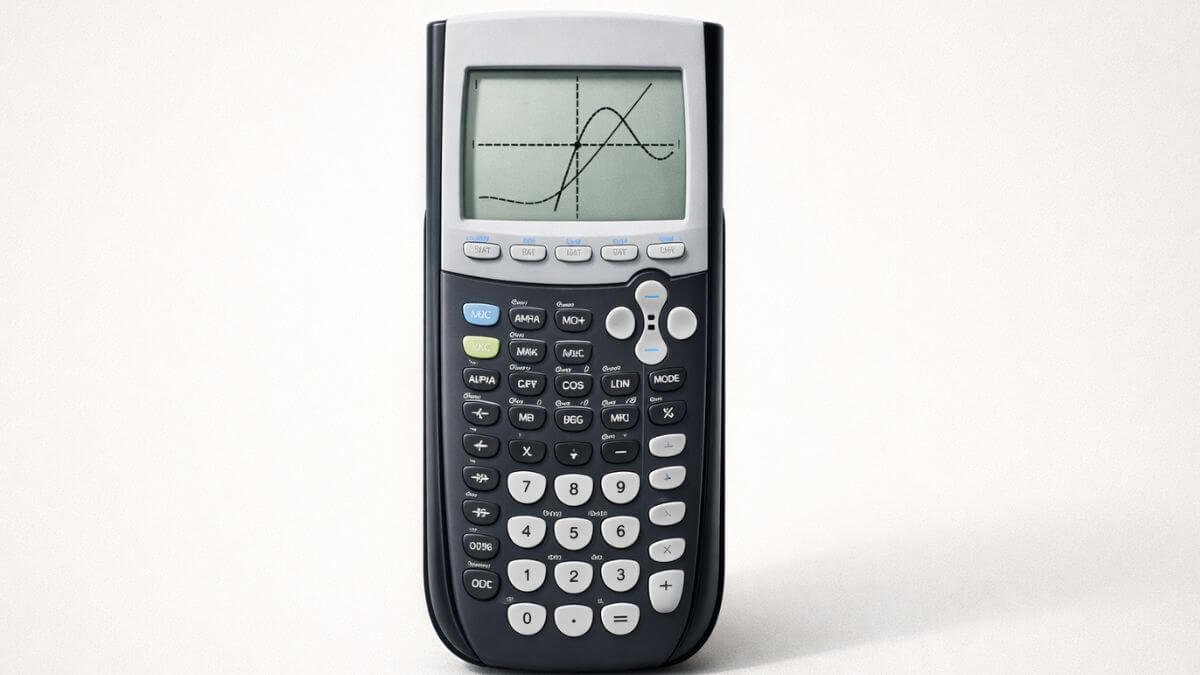
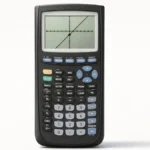
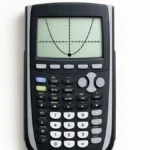
Graph mode is where a TI-84 actually earns the “graphing calculator” name it’s not just for viewing a curve, it’s for pulling exact values off that curve without doing the algebra by hand. Most guides stop at “press GRAPH and reset the zoom.” There’s a lot more the graph screen can do once it’s showing something.
Does this apply to your TI-84?
Yes, TI-84, TI-84 Plus, and TI-84 Plus CE. Every menu and key referenced below is identical across all three.
Setting up before you graph
- Confirm the calculator is in Function mode (press MODE, check Func is selected see the full mode guide if anything else looks unfamiliar)
- Press Y= and enter your equation
- Clear or deactivate any old equations you’re not using, to avoid overlapping graphs
How do I actually see the graph?
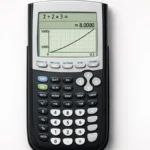
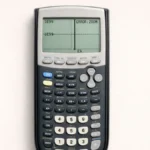
Press GRAPH. If nothing appears, it’s almost always a window range issue rather than an error in your equation there’s a dedicated troubleshooting guide if that happens.
What are the different ZOOM options, beyond ZStandard?
Most guides only mention ZStandard, but the ZOOM menu has several options worth knowing:
- 6: ZStandard resets to the default -10 to 10 window on both axes; the most common starting point
- 0: ZoomFit automatically adjusts Ymin/Ymax to fit the function within your current Xmin/Xmax, useful when you know your x-range but not what y-values to expect
- 4: ZDecimal sets the window so that TRACE lands on clean decimal values instead of long, hard-to-read numbers
- 5: ZSquare adjusts the window so one unit on the x-axis visually equals one unit on the y-axis, which matters for anything where shape distortion would be misleading, like circles or perpendicular lines
- 2: Zoom In / 3: Zoom Out narrows or widens the window around a point you select, useful for examining a specific region more closely, like a curve near a turning point
How do I manually adjust the window?
Press WINDOW and edit Xmin, Xmax, Ymin, Ymax, along with Xscl and Yscl (which control gridline spacing). This gives you full control when none of the ZOOM presets fit what you’re trying to see.
How do I trace a graph to find specific values?
Press TRACE, then use the left and right arrow keys to move along the curve the x and y coordinates update as you move. This is covered in full depth in the dedicated tracing guide, including how to jump between multiple graphed functions.
How do I find exact intercepts, maximums, or intersections from the graph screen?
This is the part most graph-mode guides skip entirely, and it’s genuinely one of the most useful features on the calculator. Press 2nd, then TRACE, to open the CALC menu:
- 1: value returns the exact y-value for any x-value you type in
- 2: zero finds an x-intercept within a range you select (useful for solving equations graphically)
- 3: minimum / 4: maximum finds a local min or max point on the curve
- 5: intersect finds where two graphed functions cross, if you have more than one equation active
For each of these, the calculator will ask you to set a left bound, right bound, and sometimes a guess move the cursor near the feature you’re looking for and press ENTER at each prompt.
This is faster and more exact than reading a value off the graph visually with TRACE, especially for anything that isn’t a clean whole number.
Common mistakes in graph mode
Relying only on TRACE for exact values. TRACE moves in fixed pixel increments, so it often lands close to but not exactly on the point you want. The CALC menu (value, zero, minimum, maximum, intersect) gives exact results instead of an approximation.
Not realizing ZSquare exists. If you’re graphing something where shape matters checking if two lines are actually perpendicular, or if a figure is really a circle ZStandard can visually distort it. ZSquare corrects for that.
Leaving old equations active. Multiple overlapping graphs make it harder to read the one you actually care about, and can interfere with which curve the CALC menu tools reference.
Practice without a physical calculator
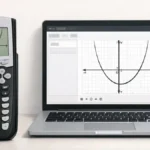
The TI-84 Calculator Tool on this site mirrors graph mode behavior, including window adjustments and tracing, so you can practice the full workflow before relying on it during a timed assignment.
FAQ
What’s the difference between TRACE and the CALC menu?
TRACE moves a cursor along the graph in fixed steps, showing approximate coordinates. The CALC menu (2nd + TRACE) calculates exact values zeros, maximums, minimums, and intersections rather than estimating from pixel position.
How do I find where two graphs intersect on a TI-84?
Graph both equations, press 2nd then TRACE to open CALC, select 5:intersect, then follow the prompts to select each curve and a guess near the intersection point.
What does ZSquare do differently from ZStandard?
ZSquare adjusts the window so the x and y axes use the same visual scale, preventing shapes like circles or perpendicular lines from looking distorted. ZStandard doesn’t guarantee equal scaling.
Why does my TRACE cursor show a value like x=3.19148936 instead of a clean number?
That’s a byproduct of the current window range and pixel spacing. Selecting ZDecimal from the ZOOM menu resets the window so TRACE lands on cleaner decimal values.
Can graph mode solve an equation for me?
Indirectly, yes graphing y = (your equation) and using CALC → zero finds where it crosses the x-axis, which is the same as solving the equation for where it equals zero.

4 thoughts on “How to Use Graph Mode on TI-84 Calculator”