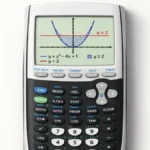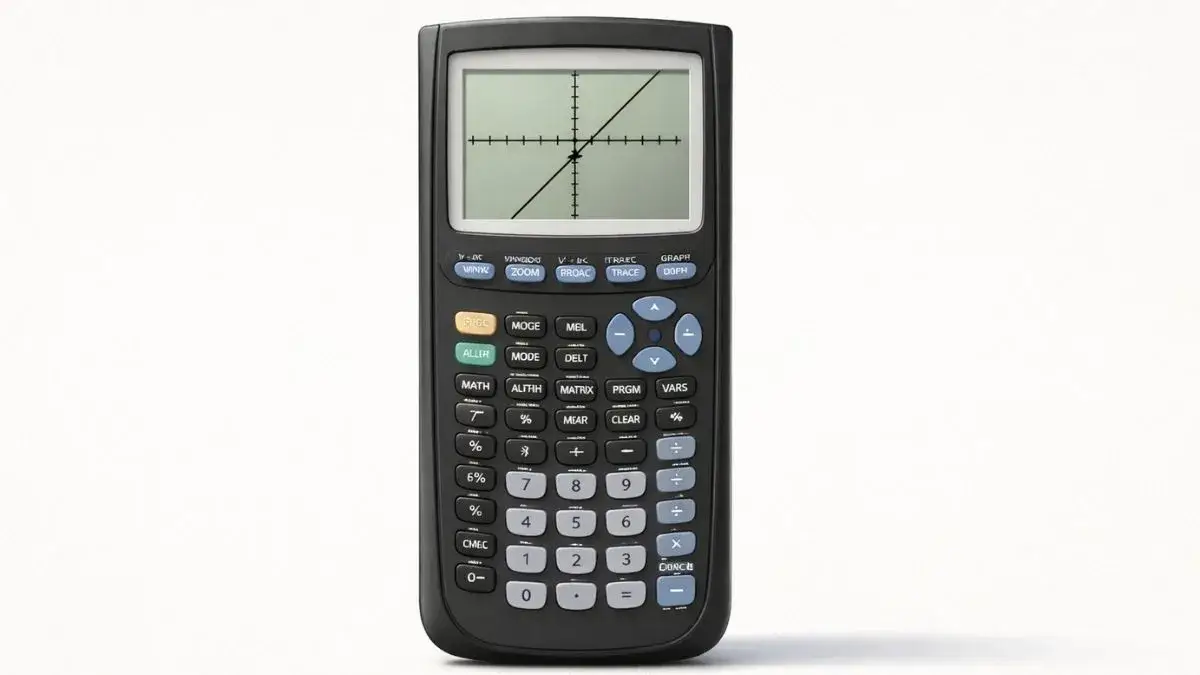
Graph the function, press 2nd + TRACE, choose 1: value, type 0 for X, and press ENTER. The y-value shown is the y-intercept.
Does this apply to your TI-84?
Yes, TI-84, TI-84 Plus, and TI-84 Plus CE all use the same CALC menu, value function, and trace tools.
What should be set up before I start?
The calculator should be in Function mode (MODE, then Func), the equation should be entered in the Y= screen, and the graph window should include x = 0. If the y-axis is off screen, press ZOOM 6 (ZStandard) or adjust the window using the graph window guide.
What is a y-intercept?
The y-intercept is the point where the graph crosses the y-axis. Since every point on the y-axis has x = 0, the y-intercept is the value of the function when x = 0. In y = mx + b form, it is the constant b.
How do I find the y-intercept of y = 2x + 3, step by step?
- Enter the equation. Press Y= and type
2X+3in Y1. - Graph it. Press GRAPH. A straight line appears, crossing the y-axis above the origin.
- Open the CALC menu. Press 2nd, then TRACE.
- Choose value. Select 1: value.
- Enter x = 0. The screen asks “X=”. Type 0 and press ENTER.
- Read the result. The bottom of the screen shows X=0 Y=3, so the y-intercept is (0, 3).
Can I find it with Trace instead?
Yes. Press TRACE, type 0, and press ENTER. The cursor jumps straight to x = 0 and shows the y-value at the bottom of the screen. This is more reliable than pressing the arrow keys, because the cursor moves in small pixel steps and can skip over x = 0 depending on your window.
How do I read the result?
The calculator shows the intercept as X and Y values at the bottom of the screen. The y-intercept point is (0, Y), and the y-value is the number to report. For y = 2x + 3, the answer is (0, 3), which also matches the constant term in the equation.
What if my equation isn’t in y = form?
Solve for y first. For 2x + 3y = 6, rearrange to y = (6 − 2x) ÷ 3 and enter it as (6-2X)/3 in Y1, using parentheses around the numerator. Then use the value function with X = 0, which gives (0, 2).
Is there another way to find the y-intercept?
Yes. Open the table (2nd + GRAPH) and look at the Y1 value in the row where X is 0. If x = 0 isn’t in the table, set TblStart to 0 in TBLSET (2nd + WINDOW). The table feature guide covers the settings.
Common mistakes and how to fix them
The y-axis isn’t visible. The window is hiding it. Use ZStandard, or set Xmin below 0 and Xmax above 0.
The cursor skips x = 0 when tracing. Don’t rely on arrow keys. Press TRACE, type 0, and press ENTER, or use 2nd + TRACE, 1: value.
The equation was entered incorrectly. A missing variable or a sign error changes the answer. Re-enter the function in Y= and compare it with the original.
ERROR when entering X = 0. The function may not be defined at x = 0, as with 1/x. In that case the graph has no y-intercept.
Practice with the online tool
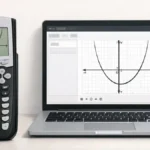
The TI-84 Calculator Tool on this site lets you enter equations, graph them instantly, and check intercepts without a physical calculator.
FAQ
How do I find the y-intercept of any function on a TI-84?
Enter it in Y=, press 2nd + TRACE, choose 1: value, type 0, and press ENTER. The Y value is the y-intercept.
Can a graph have more than one y-intercept?
No. A function has at most one y-intercept, because it can only have one output when x = 0.
Why is the y-intercept different from the x-intercept?
The y-intercept is where the graph crosses the y-axis (x = 0), while x-intercepts are where it crosses the x-axis (y = 0). A graph can have several x-intercepts but only one y-intercept.
Does the y-intercept always match the constant in the equation?
For equations written as y = mx + b, yes. For other forms, such as quadratics, it is still the constant term when the equation is written in standard form (y = ax² + bx + c).