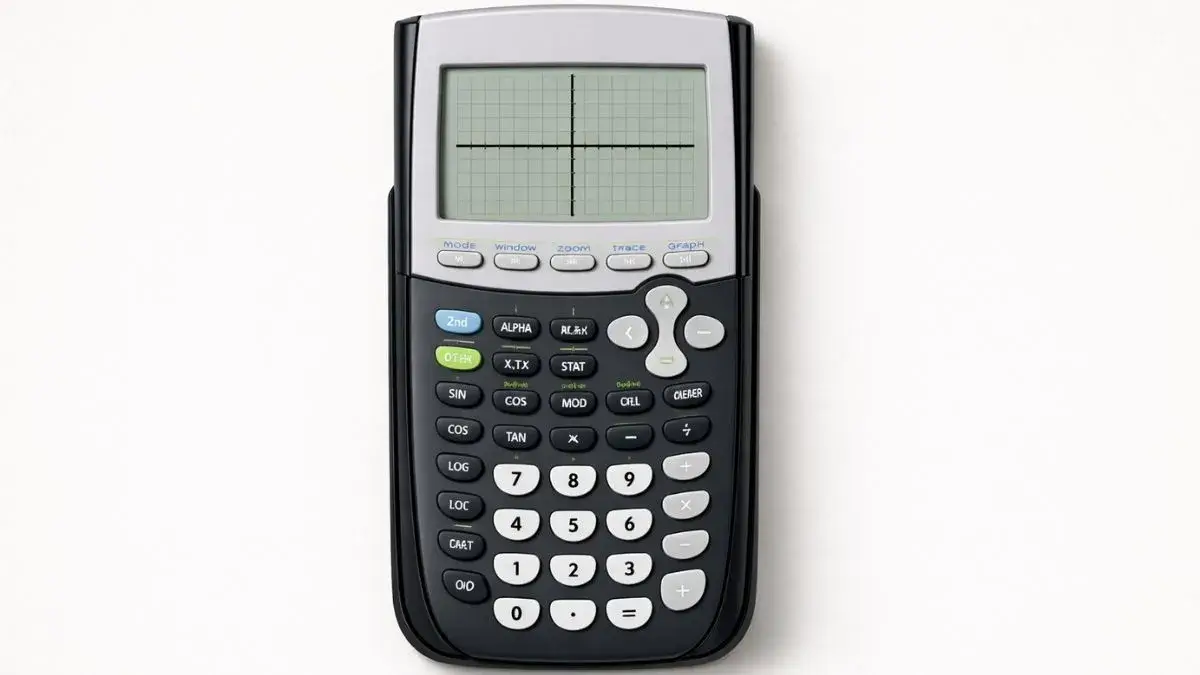
You type in an equation, hit GRAPH, and… nothing. No parabola, no line, just a blank coordinate plane staring back at you. It’s one of the most common complaints TI-84 users have, and the frustrating part is that the calculator is almost never actually broken.
Nine times out of ten, the graph is there you just can’t see it, or the calculator was never told to draw it in the first place. That’s different from a graph that appears but looks mathematically wrong this guide is specifically for when nothing shows up at all. Below are the actual reasons that happens, in the order you should check them.
Does this fix apply to your TI-84?
This applies to the TI-84, TI-84 Plus, and TI-84 Plus CE. The menu paths are identical across all three; only the screen color changes (the CE has a color display, the others are grayscale).
Why is my TI-84 not showing a graph?
There are six usual suspects. Most people hit one of the first two.
1. The graph exists it’s just off-screen
This is the single most common cause. If you’re graphing something like y = x² + 50, the default window (Xmin/Xmax of -10 to 10, Ymin/Ymax of -10 to 10) won’t show any of it the vertex alone is already off the top of the screen.
Fix it:
- Press ZOOM
- Select 6: ZStandard
This resets the window to the default -10 to 10 range on both axes, which is enough to reveal most basic functions. If your function still doesn’t appear, the values involved are probably too large or too small for that range you’ll need to adjust the graph window manually under WINDOW.
2. The equation is entered but switched off
On the Y= screen, each equation has an equals sign next to it. If that sign isn’t highlighted (shaded in), the calculator skips that equation entirely when graphing even though it’s sitting right there in the list.
Fix it:
- Press Y=
- Move the cursor onto the equals sign for your equation
- Press ENTER it should highlight
3. A Stat Plot is turned on and blocking the graph
This one catches people off guard because it has nothing to do with the equation itself. If a Stat Plot (Plot1, Plot2, or Plot3) is turned on from an earlier assignment even one you don’t remember setting up it can override your function graph or throw an “Invalid Dimension” error instead of graphing at all.
Fix it:
- Press 2nd then Y= (STAT PLOT)
- Select 4: PlotsOff
- Press ENTER
This is one of the most overlooked causes because nothing about it looks obviously wrong on the Y= screen.
4. The calculator isn’t in Function mode
If MODE is set to Par (parametric), Pol (polar), or Seq (sequence) instead of Func, a normal y = equation won’t graph the way you expect or it may not graph at all.
Fix it:
- Press MODE
- Highlight Func on the fourth row
- Press ENTER, then CLEAR to return to the home screen
5. The equation itself has a typo
A missing parenthesis, a caret in the wrong place, or using the wrong variable key (the ALPHA X instead of the X,T,θ,n key, for instance) will either throw a syntax error or graph something other than what you intended.
Fix it: Re-enter the equation from scratch rather than trying to patch it. Use the X,T,θ,n key for your variable, and wrap numerators, denominators, and exponents in parentheses when there’s any ambiguity. If you’re unsure of the correct syntax, see the full guide to entering equations on the TI-84.
6. Too many equations are active at once
If you’ve been experimenting and left four or five old equations turned on in Y=, your intended graph might be there just buried under overlapping lines that make the screen look like noise, or the calculator might be lagging as it tries to plot all of them.
Fix it: Press Y= and clear or turn off anything you’re not actively using.
A faster way to check your work
If you want to confirm what an equation should look like before troubleshooting your physical calculator, the TI-84 Calculator Tool on this site graphs the same syntax without any leftover memory, stat plots, or window settings from previous sessions useful for isolating whether the problem is your equation or your calculator’s settings.
FAQ
Why does my TI-84 show a blank screen after I press GRAPH?
Usually because the function’s values fall outside the current window range. Press ZOOM, then 6:ZStandard, to reset to a -10 to 10 default window and try again.
Can a Stat Plot really stop a graph from appearing?
Yes. An active Stat Plot with no valid data, or one left on from a previous assignment, can block your function graph or trigger an error. Turn it off with 2nd → Y= → 4:PlotsOff.
Why does my TI-84 graph a straight line when I expected a curve?
This usually means the calculator is in the wrong mode (Parametric or Polar instead of Function), or the equation was entered with the wrong exponent syntax.
Does resetting the window delete my equations?
No. ZStandard only resets the viewing window (Xmin, Xmax, Ymin, Ymax, and similar settings). It doesn’t touch anything on the Y= screen.
My TI-84 says “ERR: INVALID DIMENSION” what does that mean?
This error almost always points to an active Stat Plot referencing a list that’s empty or doesn’t exist. Turning off Stat Plots (2nd → Y= → PlotsOff) resolves it in most cases.

1 thought on “TI-84 Calculator Not Graphing? Fix It Fast”