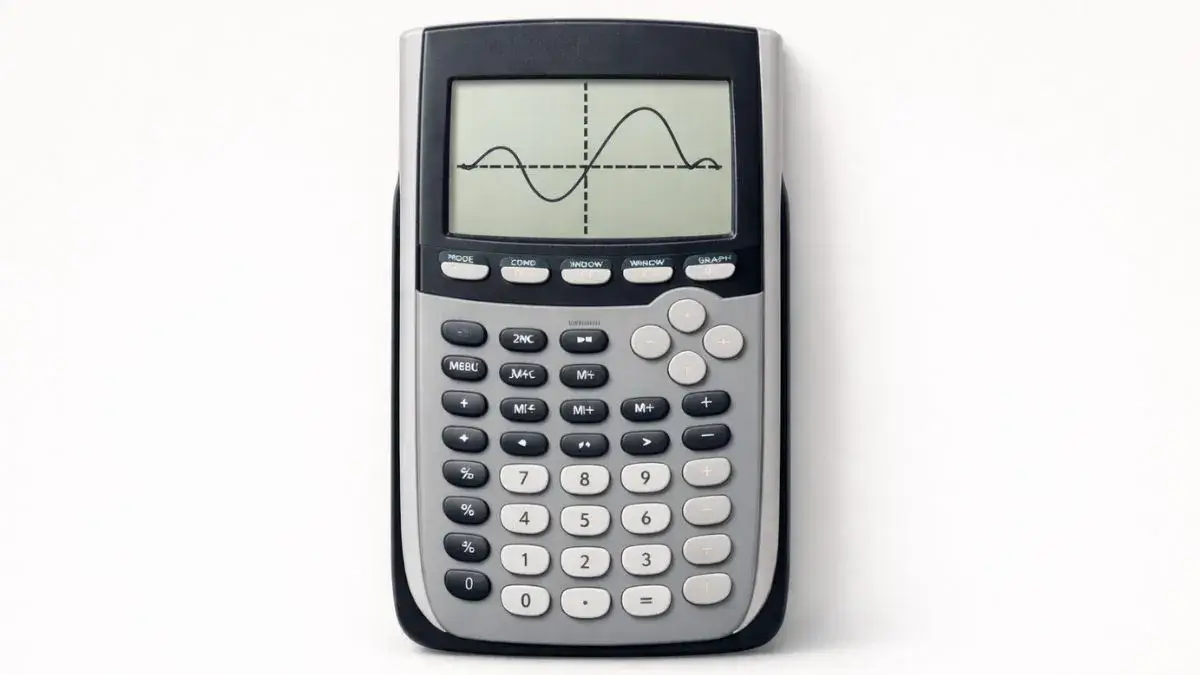
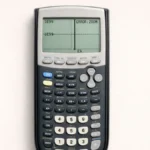
To read graph results on a TI-84, press GRAPH, press TRACE to move along the curve and read exact X and Y values, then use the 2nd + TRACE (CALC) menu to find intercepts and the turning point.
Does this apply to your TI-84?
Yes, TI-84, TI-84 Plus, and TI-84 Plus CE all display graphs, Trace values, and the CALC menu in the same way.
What should be set up before I start?
The calculator should be in Function mode (MODE, then Func), the equation should be entered in the Y= screen, and only the equations you want to read should be turned on (equals sign highlighted). If the graph doesn’t fit the screen, press ZOOM 6 (ZStandard) or adjust the window using the graph window guide.
What does a graph actually show?
Every point on the graph is an (x, y) pair that makes the equation true. Reading a graph means turning that picture back into numbers: where it crosses the axes, where it turns, and whether it rises or falls.
How do I read the results for y = x² − 2x − 3, step by step?
- Enter and graph the equation. Press Y=, type
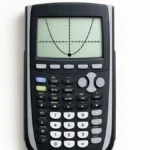
X^2-2X-3in Y1, then press ZOOM 6 to graph it in the standard window. You’ll see a parabola opening upward. - Check the axes and scale. The horizontal line is the x-axis and the vertical line is the y-axis. In the standard window each tick mark is 1 unit. Press WINDOW to see Xmin, Xmax, Ymin, Ymax and the scale values.
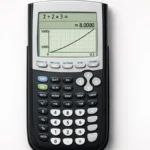
- Trace along the curve. Press TRACE and use the left and right arrow keys. The equation appears at the top of the screen, and the current X and Y values appear at the bottom.
- Jump to an exact x-value. While tracing, type a number (for example 1) and press ENTER. The cursor moves to that x-value and shows its y-value: X=1 Y=-4.
- Find the x-intercepts. Press 2nd + TRACE and choose 2: zero, then set a left bound, a right bound, and a guess for each crossing. The results are x = -1 and x = 3. The x-intercepts guide shows each prompt.
- Find the y-intercept. Press 2nd + TRACE, choose 1: value, type 0, and press ENTER. The result is Y=-3. See the y-intercept guide for more.
- Find the turning point. Because the parabola opens upward, use 2nd + TRACE, 3: minimum. The vertex is (1, -4). The vertex guide has the full steps.
What does the shape of the graph tell me?
- A straight line means a linear equation, where y changes by the same amount for every step in x.
- A U-shaped curve (parabola) means a quadratic. If it opens upward, the vertex is the lowest point. If it opens downward, the vertex is the highest.
- For y = x² − 2x − 3: the graph falls until x = 1, where y reaches its minimum of -4, then rises. That means it is decreasing for x < 1 and increasing for x > 1.
How do I read a graph with more than one equation?
When several equations are graphed, the top of the screen shows which one the Trace cursor is on (Y1, Y2, and so on). Press the up or down arrow to jump between graphs. To find where two graphs meet, use 2nd + TRACE, 5: intersect.
Can I check the graph against a table?
Yes. Press 2nd + GRAPH to open the table and compare its X and Y values with what Trace shows. If both agree, you’ve read the graph correctly. The table feature guide covers the settings.
Common mistakes and how to fix them
The axes are misread. X is the horizontal value and Y is the vertical value. Check the bottom of the Trace screen, which labels each one.
The scale is assumed to be 1 unit per tick. The tick spacing depends on Xscl and Yscl in the WINDOW menu. Check those values before reading by eye.
Part of the graph is hidden. The window may cut off intercepts or the vertex. Use ZStandard, or widen the window until the whole shape is visible.
Values are guessed by eye. Reading a point from the picture is only an estimate. Use Trace, or the CALC menu, to get exact values.
Trace skips over the point you need. Trace moves in small pixel steps. Type the x-value and press ENTER to land on it exactly.
The wrong graph is being traced. With more than one equation active, press the up or down arrow and check Y1, Y2 at the top of the screen.
Practice with the online tool
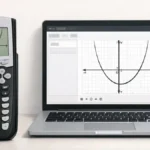
The TI-84 Calculator Tool on this site lets you graph equations, trace points, and adjust the window just like a physical TI-84, which makes it handy for practicing graph reading before homework or a test.
FAQ
How do I find the exact coordinates of a point on a TI-84 graph?
Press TRACE, type the x-value you want, and press ENTER. The calculator shows the exact X and Y values at the bottom of the screen.
How do I know if a graph is increasing or decreasing?
Trace from left to right. If the Y values go up, the graph is increasing there. If they go down, it is decreasing. A parabola changes direction at its vertex.
Why does my graph look different from the one in my textbook?
The window is probably different. Try the same Xmin, Xmax, Ymin and Ymax values as the textbook, or use ZStandard as a starting point.
What is the difference between a zero and an x-intercept?
They describe the same point. An x-intercept is where the graph crosses the x-axis, and the x-value there is a zero (or root) of the function.



3 thoughts on “How to Read Graph Results on TI-84 Calculator”