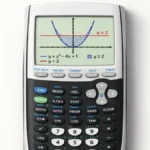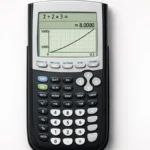
Graphing two lines and finding where they cross works fine for a two-variable system. It stops working the moment you have three variables, since a TI-84 in standard Function mode can’t graph that. This guide covers the graphing method for two-variable systems, plus the matrix method, which handles two, three, or more variables and it’s often faster even when graphing is an option.
Does this apply to your TI-84?
Yes, TI-84, TI-84 Plus, and TI-84 Plus CE all support both methods below, including the Matrix menu.
Method 1: Graph and find the intersection (two variables)
Best for two-variable systems where you want to see the equations visually.
Example: solve y = 2x + 1 y = −x + 4
- Press Y=, enter
2X+1next to Y₁ - Enter
-X+4next to Y₂ - Press GRAPH
- Press 2nd, then TRACE, and select 5: intersect
- Press ENTER to confirm each curve, then ENTER again near the crossing point for a guess
The x and y values shown are the solution the one point that satisfies both equations.
Method 2: Solve with matrices (works for 2, 3, or more variables)
This is the method most guides skip, and it’s the only practical option once you’re past two variables or a fast alternative even at two.
Example: solve the system 2x + y = 5 x − y = 1
- Press 2nd, then x⁻¹ (MATRIX)
- Arrow to the EDIT tab, select [A]
- Set the dimensions to 2 rows × 3 columns — this represents the augmented matrix (coefficients plus constants) for a 2-equation system
- Enter the values row by row:
2, 1, 5for the first equation,1, -1, 1for the second - Press 2nd, then MODE (QUIT) to return to the home screen
- Press 2nd, then x⁻¹ again, arrow to the MATH tab, and select rref(
- Press 2nd, then x⁻¹, select [A], then close the parenthesis and press ENTER
The result is a reduced matrix where the last column gives the solution directly the top-right value is x, the bottom-right value is y.
For a three-variable system, the same process applies with a 3×4 matrix (three coefficients plus one constant per row, three rows).
What if the graphs never intersect, or the lines look identical?
Two cases the graphing method alone doesn’t explain clearly:
Parallel lines that never cross mean the system has no solution. If Method 2 is used instead, the rref result will show a row that reduces to something like 0 = 1 (or another impossible statement) a clear sign of no solution, more reliable than trying to visually confirm two lines never meet on a limited graph window.
Lines that overlap completely mean the system has infinite solutions both equations describe the same line. In the matrix method, this shows up as a row of all zeros after reduction, rather than a specific numeric solution.
Common mistakes and how to fix them
Only entering one equation. Check that every equation in the system has its own line in Y= before graphing it’s an easy step to skip when moving quickly.
Assuming a system always has exactly one solution. Systems can have one solution, no solution (parallel lines), or infinitely many (identical lines) check for these before assuming an error occurred.
Entering the augmented matrix dimensions incorrectly. The column count should always be one more than the number of variables (to include the constants column). A 3-variable system needs a 3×4 matrix, not 3×3.
Trying to graph a 3-variable system. Standard Function mode on a TI-84 graphs y = f(x), which only handles two variables. For three or more, the matrix method is the correct approach, not graphing.
Practice both methods
The TI-84 Calculator Tool on this site supports graphing two-equation systems directly, which is useful for confirming a matrix-method answer visually when you’re working with just two variables.
FAQ
Can a TI-84 solve a system of three equations?
Not by graphing in standard Function mode. Use the matrix method instead enter the system as an augmented matrix and use rref( to solve it.
What does rref( do on a TI-84?
It reduces a matrix to row-echelon form, which for an augmented system matrix directly reveals the solution in the last column once fully reduced.
How do I know if a system has no solution?
Graphically, the lines never intersect (they’re parallel). Using the matrix method, the reduced matrix will contain a row that represents an impossible statement, like 0 = 1.
How do I know if a system has infinite solutions?
Graphically, the lines overlap completely. Using the matrix method, the reduced matrix will contain a row of all zeros.
Is the matrix method faster than graphing for a two-variable system?
Often, yes, especially if you’re already comfortable with the Matrix menu, since it skips window setup and CALC menu navigation entirely.