Many students find graphing difficult, not because they do not understand the math, but because they are unsure how to use graph mode on a TI 84 calculator. Even when an equation is entered correctly, the graph may not appear, may look distorted, or may be confusing to interpret. These issues often lead students to believe the calculator is giving incorrect results.
This problem usually happens because graph mode settings and graph windows are not understood properly. In this guide, you will learn how to use graph mode on a TI 84 calculator step by step, so you can plot equations correctly and understand what the graph is showing.
What You Need Before Starting
Before using graph mode, make sure the calculator is prepared correctly.
TI 84 Calculator Compatibility
The instructions in this guide apply to:
- TI 84
- TI 84 Plus
- TI 84 Plus CE
The graphing process is the same across these models, with only small visual differences.
Required Calculator Settings
Before graphing:
- Calculator must be in Function mode
- Angle mode should be set correctly (usually Degree)
- Old equations should be cleared if not needed
These settings help ensure graphs display correctly.
Math Prerequisites
You should understand:
- Basic algebraic equations
- Variables such as x
- Simple linear or quadratic equations
No advanced graphing knowledge is required.
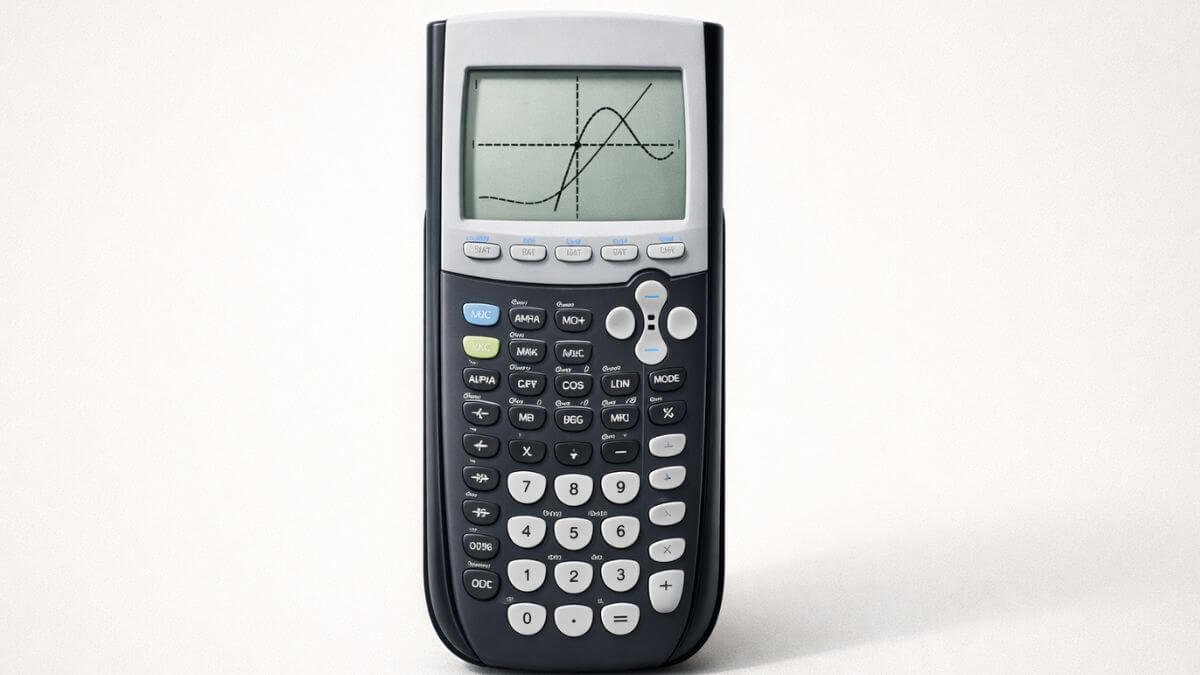
How to Use the TI-84 Calculator
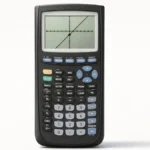
Graph mode allows the TI 84 calculator to display equations visually on a coordinate plane. Equations entered in the function screen are converted into graphs when graph mode is activated. Learning how to switch between the equation entry screen and the graph screen helps students connect equations with their visual meaning.
Understanding this basic workflow makes it easier to troubleshoot when a graph does not appear as expected.
Step-by-Step Solution Using TI 84
The steps below explain how to use graph mode correctly.
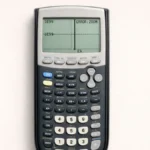
Step 1: Enter the Equation
- Press Y=
- Enter the equation you want to graph next to Y₁
- Make sure the equation is typed correctly
The equation is now ready to be graphed.
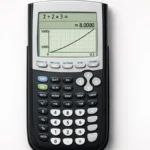
Step 2: Open the Graph Screen
- Press GRAPH
- The calculator will attempt to display the graph
If nothing appears, the graph window may need adjustment.
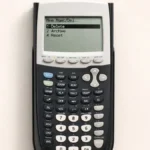
Step 3: Reset the Graph Window
- Press ZOOM
- Select 6:ZStandard
This resets the viewing window and usually makes the graph visible.
Step 4: Adjust the Graph Window if Needed
- Press WINDOW
- Change Xmin, Xmax, Ymin, and Ymax if required
Adjusting the window helps focus on specific parts of the graph.
Step 5: Trace the Graph
- Press TRACE
- Use the arrow keys to move along the graph
The calculator shows exact x and y values at each point.
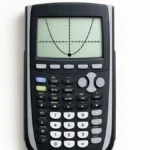
Step 6: Interpret the Graph
- Look for intercepts, slopes, and curves
- Observe how changes in the equation affect the graph
This step helps students understand the relationship between equations and graphs.
Common Mistakes and How to Fix Them
Mistake 1: Graph Does Not Appear
Why it happens:
The graph window is not set correctly.
Fix:
Use the standard zoom option to reset the window.
Mistake 2: Multiple Graphs Overlapping
Why it happens:
Old equations are still active.
Fix:
Clear unused equations in the Y= screen.
Mistake 3: Graph Looks Incorrect
Why it happens:
The equation was entered incorrectly.
Fix:
Recheck signs, variables, and parentheses.
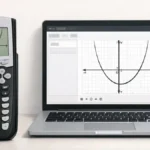
Using the Online TI-84 Tool
The same graphing steps can be practiced using the TI 84 Calculator Tool available on this website. The online tool mirrors graph mode behavior, allowing students to plot equations, adjust graph windows, and trace results accurately.
This is useful for practice, revision, and classroom demonstrations without needing a physical calculator.
Graph mode is one of the most important features of a TI 84 calculator. Many graphing problems occur due to incorrect settings or misunderstanding how the graph window works. By entering equations correctly, using the standard zoom option, and adjusting the window when needed, students can create clear and accurate graphs.
This guide provides a clear explanation of how to use graph mode on a TI 84 calculator, helping students and teachers graph equations confidently and correctly.
4 thoughts on “How to Use Graph Mode on TI 84 Calculator”