Inequalities are similar to equations, but instead of finding a single value, you are finding a range of values that satisfy a condition. Many students find inequalities confusing, especially when trying to solve them using a calculator.
The TI 84 graphing calculator does not directly solve inequalities like equations, but it provides a powerful way to solve them using graphs. By comparing two functions and analyzing where one is greater than or less than the other, students can identify solution intervals visually.
What You Need Before Starting
Before solving inequalities, make sure your calculator is ready.
TI 84 Calculator Compatibility
This method works for:
- TI 84
- TI 84 Plus
- TI 84 Plus CE
All models support graph-based inequality solving.
Required Calculator Settings
Before starting:
- Calculator should be in Function mode
- Equations must be entered in the Y= screen
- Graph window should clearly display both graphs
Math Prerequisites
You should understand:
- Basic inequalities (>, <, ≥, ≤)
- Graph interpretation
- Coordinate plane concepts
No advanced algebra is required.
How to Use the TI-84 Calculator to Solve Inequalities
The TI 84 solves inequalities by graphing two expressions and comparing their values.
For example:
x² > 4
Can be rewritten as:
y₁ = x²
y₂ = 4
The solution is where the graph of y₁ is above y₂.
Step-by-Step: Solve Inequalities on TI 84
We will solve:
x² > 4
Step 1: Enter Both Functions
- Press Y=
- Enter
X^2in Y₁ - Enter
4in Y₂ - Press ENTER
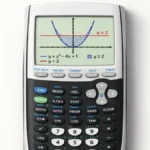
Step 2: Graph the Functions
- Press GRAPH
You will see:
- A parabola (y = x²)
- A horizontal line (y = 4)
Step 3: Identify Intersection Points
The graphs intersect where:
x² = 4
These points are:
- x = -2
- x = 2
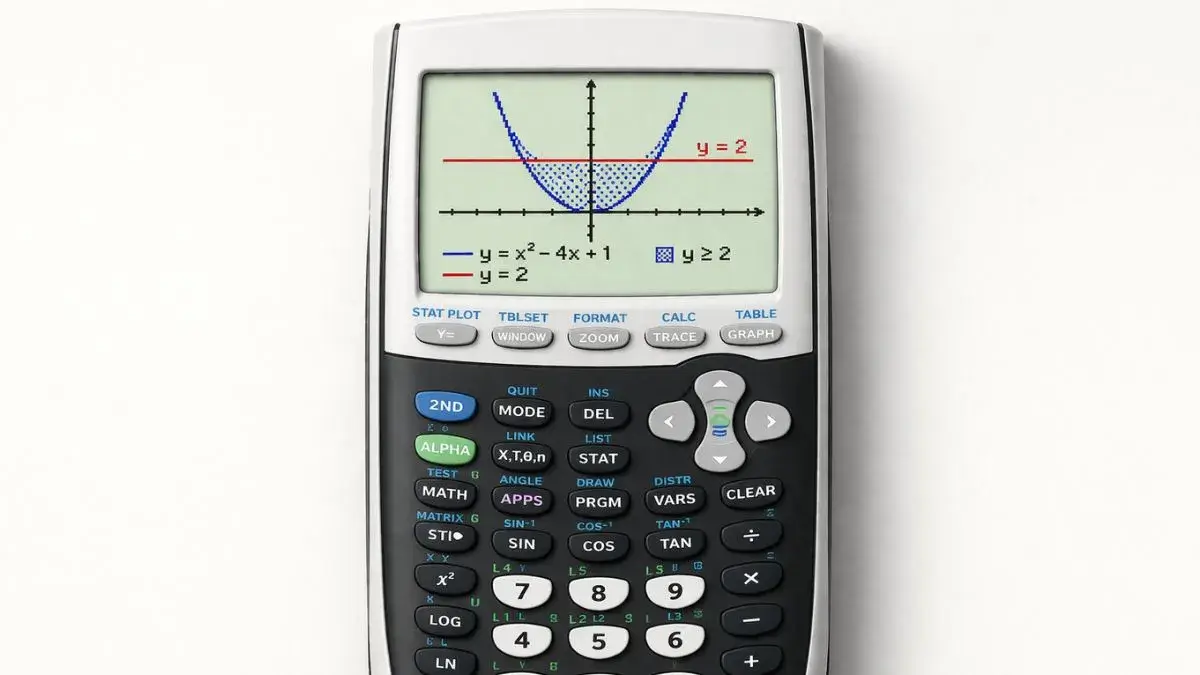
Step 4: Determine the Solution Region
Look at where:
- The parabola is above the line
This occurs when:
- x < -2
- x > 2
Step 5: Write the Final Answer
The solution is:
x < -2 or x > 2
This can also be written in interval form:
(-∞, -2) ∪ (2, ∞)
Understanding Inequality Graphs
When solving inequalities graphically:
- Above a graph means greater than
- Below a graph means less than
- Intersection points act as boundary values
The TI 84 helps visualize these relationships clearly.
Common Mistakes and How to Fix Them
• Only graphing one equation
Cause: Forgetting to compare two expressions
Fix: Always enter both sides of the inequality
• Misinterpreting graph regions
Cause: Confusion between above and below
Fix: Check which graph is higher
• Graph window hiding intersections
Cause: Incorrect viewing range
Fix: Use Zoom Standard or adjust window settings
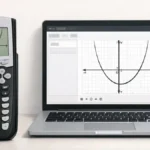
Using the Online TI-84 Tool
You can also solve inequalities using the TI 84 Calculator Tool available on this website.
The online tool allows you to:
- Graph multiple functions
- Compare graph positions
- Identify solution intervals
- Practice inequality problems easily
Solving inequalities on a TI 84 calculator becomes easier when using graphing techniques. By plotting both sides of the inequality and analyzing where one graph is above or below the other, students can identify solution intervals visually.
- How to Find X-Intercepts on TI 84 Calculator
- How to Graph Quadratic Functions on TI 84 Calculator
- How to Read Graph Results on TI 84 Calculator
Can I solve linear inequalities this way?
No, but it can solve them using graph comparison.
What does “above the graph” mean?
Why do I need two graphs?