Many students believe their TI 84 calculator is not working correctly when a graph does not appear on the screen. In most cases, the issue is not the equation itself but the graph window settings. If the viewing range is too small, too large, or incorrectly set, important parts of the graph may not be visible.
This problem occurs because the graph window controls what portion of the coordinate plane is displayed. Without understanding how to adjust these settings, students may misinterpret results. In this , you will learn how to adjust the graph window on a TI 84 calculator tool step by step, helping students and teachers view graphs clearly and accurately.
What You Need Before Starting
Before adjusting the graph window, ensure the calculator is properly prepared.
TI 84 Calculator Compatibility
This guide applies to:
- TI 84
- TI 84 Plus
- TI 84 Plus CE
All these models use the same graph window settings.
Required Calculator Settings
Before starting:
- Calculator must be in Function mode
- An equation should already be entered in the Y= screen
- Graph screen should be accessible
Correct setup ensures adjustments affect the intended graph.
Math Prerequisites
You should understand:
- Basic coordinate plane concepts
- Meaning of x and y values
- How equations appear as graphs
No advanced math is required.
How to Use the TI-84 Calculator
The TI 84 calculator uses a graph window to define the visible portion of the coordinate plane. The window determines the minimum and maximum values shown on both axes. Adjusting these settings changes how much of the graph is visible and how it appears.
Learning how to manage the graph window helps students avoid display errors and better understand graph behavior.
Step-by-Step Solution Using TI 84
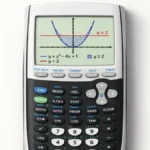
We will use a simple equation:
y = x² − 10
Step 1: Enter the Equation
- Press Y=
- Enter
X^2 - 10 - Press ENTER
The equation is now stored.
Step 2: Open the Graph Screen
- Press GRAPH
- If the graph does not appear clearly, adjust the window
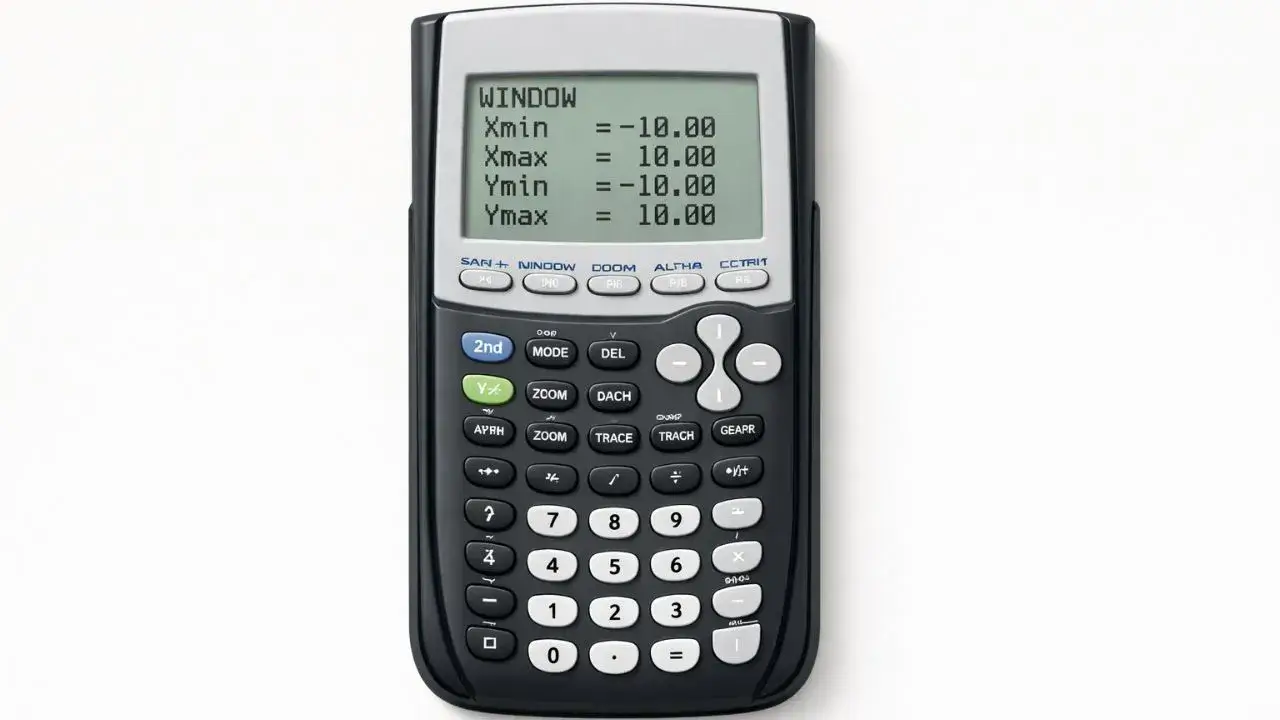
Step 3: Access the Window Settings
- Press WINDOW
- The screen displays Xmin, Xmax, Ymin, Ymax, and scale values
These settings control the visible range.
Step 4: Adjust X-Values
- Change Xmin and Xmax to widen or narrow the horizontal view
- Example: Set Xmin to -10 and Xmax to 10
This ensures the graph fits horizontally.
Step 5: Adjust Y-Values
- Change Ymin and Ymax to adjust vertical visibility
- Example: Set Ymin to -20 and Ymax to 20
This ensures the full graph is visible.
Step 6: View the Updated Graph
- Press GRAPH
- The graph should now display clearly
Step 7: Use Standard Zoom (Optional)
- Press ZOOM
- Select 6:ZStandard
This quickly resets the graph window to common default settings.
Common Mistakes and How to Fix Them
Mistake 1: Graph Not Visible
Why it happens:
The graph is outside the viewing range.
Fix:
Adjust Xmin, Xmax, Ymin, and Ymax.
Mistake 2: Graph Appears Too Compressed
Why it happens:
The viewing range is too wide.
Fix:
Narrow the window settings for better detail.
Mistake 3: Graph Looks Distorted
Why it happens:
Scale settings are uneven.
Fix:
Use standard zoom or adjust scale values manually.
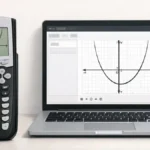
Using the Online TI-84 Tool
The same graph window adjustments can be practiced using the TI 84 Calculator Tool available on this website. The online tool allows students to modify viewing ranges and immediately see how the graph changes.
Adjusting the graph window on a TI 84 calculator is essential for viewing equations clearly and accurately. Many graph display problems occur because the viewing range is incorrect. By accessing window settings and adjusting the x and y values, students can ensure graphs appear correctly.


2 thoughts on “How to Adjust Graph Window on TI 84 Calculator”