Quadratic functions are different from linear functions because they produce curved graphs instead of straight lines. Many students understand the equation format on paper but struggle when trying to graph quadratic functions correctly on a TI 84 calculator. Common problems include graphs not appearing, curves looking distorted, or confusion about identifying key features such as the vertex and intercepts.
These issues usually happen because students are unsure how quadratic equations behave visually and how the calculator displays them. In this , you will learn how to graph quadratic functions on a TI 84 calculator Online step by step, using clear explanations that support both students and teachers.
What You Need Before Starting
Before graphing quadratic functions, make sure your calculator is ready.
TI 84 Calculator Compatibility
This guide works for:
- TI 84
- TI 84 Plus
- TI 84 Plus CE
All these models graph quadratic functions in the same way.
Required Calculator Settings
Before starting:
- Calculator must be in Function mode
- Old equations should be cleared if not needed
- Graph window should be set appropriately
These settings ensure the graph displays correctly.
Math Prerequisites
You should understand:
- Quadratic functions in the form y = ax² + bx + c
- Basic graph terminology
- Meaning of intercepts and vertex
No advanced algebra is required.
How to Use the TI-84 Calculator
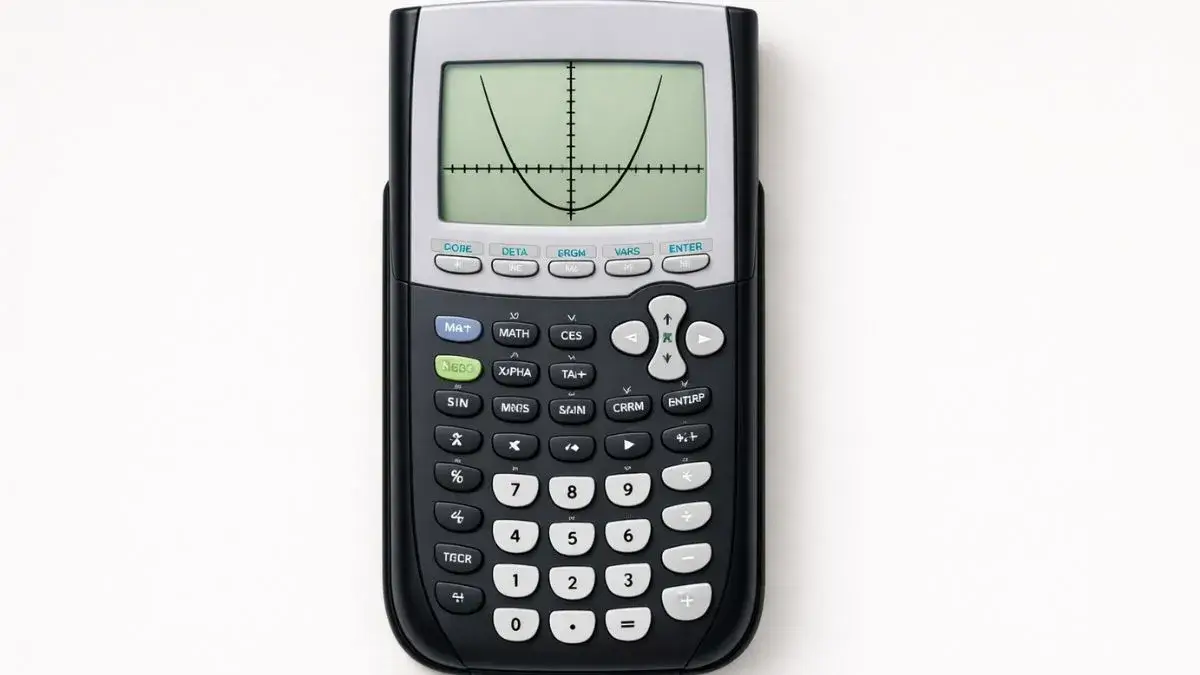
The TI 84 calculator graphs quadratic functions by converting the equation into a curved shape called a parabola. When the function is entered correctly, the calculator displays the curve on the coordinate plane. The graph allows students to observe important features such as where the parabola opens, its vertex, and its intercepts.
Understanding how to switch between equation entry, graph view, and tracing helps students interpret quadratic graphs correctly.
Step-by-Step Solution Using TI 84
We will graph the quadratic function:
y = x² − 4x + 3
Step 1: Open the Equation Entry Screen
- Press Y=
- Make sure the cursor is next to Y₁
This is where the function will be entered.
Step 2: Enter the Quadratic Function
- Type
X^2 - 4X + 3 - Press ENTER
The equation is now stored.
Step 3: Display the Graph
- Press GRAPH
- A curved parabola should appear on the screen
If nothing appears clearly, adjust the graph window.
Step 4: Reset the Graph Window (If Needed)
- Press ZOOM
- Select 6:ZStandard
This often provides a clear default view.
Step 5: Identify Key Features
Observe the graph and look for:
- The lowest or highest point (vertex)
- Where the graph crosses the x-axis (x-intercepts)
- Where the graph crosses the y-axis (y-intercept)
These features help interpret the quadratic function.
Step 6: Use the Trace Feature
- Press TRACE
- Use arrow keys to move along the curve
The calculator displays exact x and y values at each point.
Step 7: Find Intercepts (Optional)
- Press 2nd → TRACE
- Select 2:Zero
- Follow the on-screen steps to locate intercepts
This provides exact solution values.
Common Mistakes and How to Fix Them
Mistake 1: Forgetting the Squared Term
Why it happens:
Students accidentally omit the exponent.
Fix:
Use the exponent key carefully when entering the function.
Mistake 2: Parabola Not Visible
Why it happens:
Graph window settings are incorrect.
Fix:
Reset to standard zoom or adjust window values.
Mistake 3: Misinterpreting the Vertex
Why it happens:
Students confuse intercepts with the vertex.
Fix:
Remember that the vertex is the turning point of the parabola.
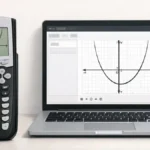
Using the Online TI-84 Tool
The same steps can be followed using the TI 84 Calculator Tool available on this website. The online tool allows students to graph quadratic functions instantly, adjust the graph window, and trace important points accurately.
Graphing quadratic functions on a TI 84 calculator becomes manageable when equations are entered correctly and graph settings are adjusted properly. Most issues occur due to input mistakes or incorrect window settings. By using trace tools and observing key features, students can interpret quadratic graphs accurately.
- How to Graph Linear Functions on TI 84 Calculator
- How to Adjust Graph Window on TI 84 Calculator
- How to Find Zeros and Intercepts on TI 84 Calculator
Yes, if the parabola touches the x-axis at exactly one point.
Use the trace feature or specialized calculation options.
A quadratic function graphs as a parabola.
This depends on the coefficient of the squared term.


1 thought on “How to Graph Quadratic Functions on TI 84 Calculator”