The table feature on a TI 84 calculator is a useful tool that allows students to view a list of x and y values for a function. Instead of only looking at a graph, students can analyze exact numerical values and understand how a function behaves.
Many students overlook this feature, even though it is very helpful for checking answers, understanding patterns, and solving problems.
What You Need Before Starting
Before using the table feature, ensure the calculator is properly set up.
TI 84 Calculator Compatibility
This method works for:
- TI 84
- TI 84 Plus
- TI 84 Plus CE
All models include the table function.
Required Calculator Settings
Before starting:
- Calculator should be in Function mode
- A function must be entered in the Y= screen
- Table settings should be configured correctly
Math Prerequisites
You should understand:
- Basic functions (e.g., y = x², y = 2x + 3)
- Relationship between x and y values
- Simple graph interpretation
No advanced math is required.
How to Use the TI-84 Table Feature
The TI 84 calculator creates a table by automatically calculating y-values for different x-values.
This allows students to:
- View function values quickly
- Identify patterns in data
- Check solutions
- Analyze graphs numerically
The table works alongside the graph feature for better understanding.
Step-by-Step: Use Table Feature on TI 84
We will use the function:
y = x²
Step 1: Enter the Function
- Press Y=
- Enter
X^2 - Press ENTER
Step 2: Open Table Settings
- Press 2nd
- Press WINDOW (this opens TBLSET)
You will see:
- TblStart (starting x-value)
- ΔTbl (step size)
Step 3: Set Table Values
Adjust the settings:
- Set TblStart = 0
- Set ΔTbl = 1
This means the table will start at x = 0 and increase by 1.
Step 4: View the Table
- Press 2nd
- Press GRAPH (TABLE)
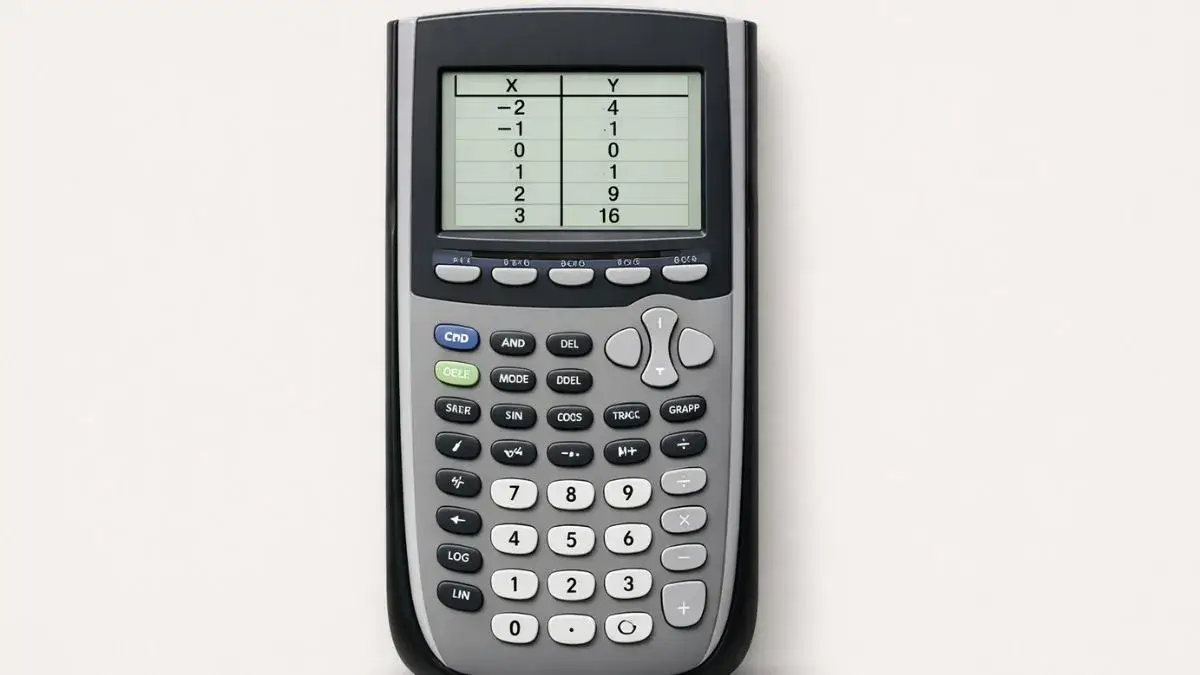
You will see:
- A column of x-values
- Corresponding y-values
Example:
- x = 0 → y = 0
- x = 1 → y = 1
- x = 2 → y = 4
Step 5: Scroll Through Values
Use arrow keys to:
- Move up and down the table
- View more values
This helps analyze the function behavior.
Understanding Table Results
The table shows how the function changes:
- Each x-value produces a y-value
- Patterns become easier to observe
- Useful for identifying growth or trends
This is especially helpful for quadratic and linear functions.
Common Mistakes and How to Fix Them
• Table not showing values
Cause: No function entered
Fix: Enter equation in Y= screen
• Values increasing too fast
Cause: Step size (ΔTbl) too large
Fix: Reduce ΔTbl value
• Incorrect starting point
Cause: TblStart set incorrectly
Fix: Adjust starting value
Using the Online TI-84 Tool
You can also practice using the table feature with the TI 84 Calculator Tool available on this website.
The online tool allows you to:
- Enter functions
- View tables instantly
- Analyze value patterns
- Practice without a physical calculator
The table feature on a TI 84 calculator is a powerful tool for understanding functions through numerical values. By entering a function, adjusting table settings, and viewing the results, students can easily analyze how equations behave.
Using the table feature alongside graphing tools improves accuracy and helps students develop a deeper understanding of mathematical concepts.