The x-intercepts of a graph are the points where the graph crosses the x-axis. At these points, the value of y equals zero. Finding x-intercepts is important because they often represent the solutions of an equation.
Students can calculate these solutions algebraically, but the TI 84 graphing calculator provides an easier graphical method. By graphing the function and using the calculator’s zero feature, you can quickly find the x-intercepts.
What You Need Before Starting
Before finding x-intercepts, make sure the calculator is set up correctly.
TI 84 Calculator Compatibility
This method works for:
- TI 84
- TI 84 Plus
- TI 84 Plus CE
All models include the same graph calculation tools.
Required Calculator Settings
Before starting:
- The calculator should be in Function mode
- The equation must be entered in the Y= screen
- The graph window should show where the graph crosses the x-axis
If the intercept is not visible, adjust the window settings.
Math Prerequisites
You should understand:
- Basic coordinate plane concepts
- The relationship between equations and graphs
- That x-intercepts occur when y = 0
No advanced algebra is required.
How to Use the TI-84 Calculator to Find X-Intercepts
The TI 84 calculator includes a Zero calculation feature that identifies where the graph crosses the x-axis.
When using this feature:
- The calculator searches the graph between two points
- It calculates where the function equals zero
- It displays the exact coordinate values
This tool is commonly used for solving equations graphically.
Step-by-Step: Find X-Intercepts on TI 84
We will use the example function:
y = x² − 4
Step 1: Enter the Equation
- Press Y=
- Enter
X^2 - 4 - Press ENTER
The function is now stored.
Step 2: Display the Graph
- Press GRAPH
You should see a parabola crossing the x-axis.
If the graph is difficult to see:
- Press ZOOM
- Select 6:ZStandard
This resets the viewing window.
Step 3: Open the Calculation Menu
- Press 2nd
- Press TRACE
This opens the CALC menu.
Step 4: Select the Zero Function
Choose:
2:Zero
The calculator will now search for the x-intercept
Step 5: Set the Left Bound
Move the cursor to the left side of the intercept and press ENTER.
Step 6: Set the Right Bound
Move the cursor to the right side of the intercept and press ENTER.
Step 7: Enter the Guess
Move the cursor near the intercept and press ENTER.
The calculator will display the x-intercept coordinate.
Example result:
(-2, 0)
Repeat the steps to find the second intercept.
Understanding X-Intercept Results
The result appears as:
(x, 0)
Where:
- x is the solution of the equation
- 0 represents the y-value at the intercept
For example:
y = x² − 4
X-intercepts are:
- (-2, 0)
- (2, 0)
These are the points where the graph crosses the x-axis.
Common Mistakes and How to Fix Them
• Graph window hides intercept
Cause: Window range is incorrect.
Fix: Use Zoom Standard or adjust Xmin and Xmax.
• Selecting incorrect bounds
Cause: Bounds placed on the same side of the intercept.
Fix: Place bounds on both sides of the crossing point.
• Equation entered incorrectly
Cause: Missing exponent or sign error.
Fix: Re-enter the function carefully.
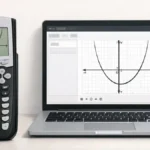
Using the Online TI-84 Tool
You can also practice finding intercepts using the TI 84 Calculator Tool available on this website.
The online calculator allows you to:
- Enter equations instantly
- Graph functions quickly
- Identify intercepts and solutions
- Practice graph analysis without a physical calculator
This helps students understand graph behavior more easily.
X-intercepts represent the solutions of an equation where the graph crosses the x-axis. The TI 84 graphing calculator provides a quick way to find these points using the Zero function. By entering the equation, graphing the function, and selecting the correct bounds, students can easily identify intercept points.