Tracing graphs on a TI 84 calculator is one of the most important skills for students learning algebra and precalculus. While many students can plot a function graph successfully, they often struggle when asked to find exact coordinate values. Estimating values directly from the screen can lead to rounding errors and incorrect answers.
The trace feature on a TI 84 graphing calculator allows students to move along a graph and read precise x and y values. Understanding how to use this feature improves graph interpretation, helps verify solutions, and builds confidence in working with linear and quadratic functions.
What You Need Before Starting
Before using the graph tracing feature, confirm the following:
TI 84 Calculator Compatibility
This method works for:
- TI 84
- TI 84 Plus
- TI 84 Plus CE
All models support the same trace function and graphing tools.
Required Calculator Settings
Make sure:
- Calculator is in Function mode
- An equation is entered in the Y= screen
- The graph is visible
- Graph window settings are reasonable
Incorrect graph window settings may prevent proper tracing.
Math Prerequisites
You should understand:
- The coordinate plane
- Meaning of x-axis and y-axis
- Basic function graph concepts
No advanced math is required.
How to Use the TI-84 Calculator for Graph Tracing
The TI 84 graphing calculator allows interactive graph analysis. Once a function is graphed, you can activate the trace feature to examine specific coordinate values.
When tracing:
- A cursor appears on the function graph
- The calculator displays exact x-values
- The calculator displays corresponding y-values
- You can move point-by-point along the graph
This is especially useful when solving equations graphically or checking intercepts.
Step-by-Step: How to Trace Graphs on TI 84
We will trace the function:
y = x² − 3
Step 1: Enter the Function
- Press Y=
- Type
X^2 - 3 - Press ENTER
The function is now stored.
Step 2: Display the Graph
- Press GRAPH
- A parabola should appear on the screen
If the graph is not visible:
- Press ZOOM
- Select 6:ZStandard
This resets common graph window settings.
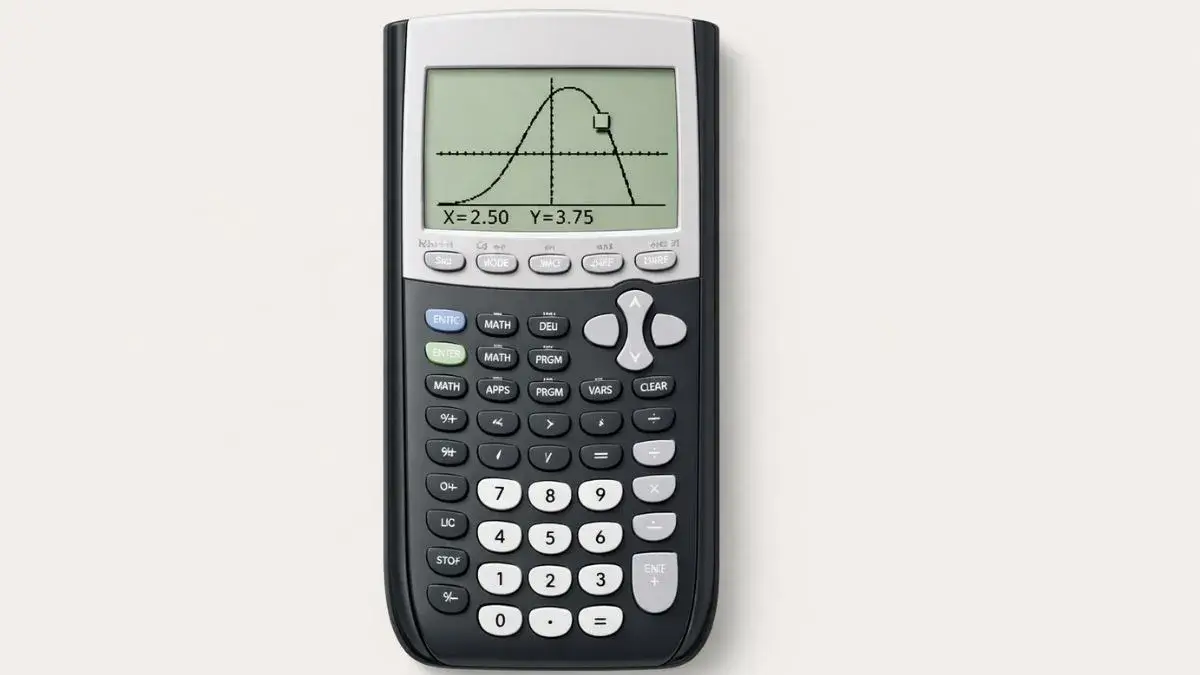
Step 3: Activate the Trace Feature
- Press TRACE
- A blinking cursor appears on the graph
At the bottom of the screen, you will see:
- x = current value
- y = corresponding value
These represent exact coordinate values on the graph.
Step 4: Move Along the Graph
- Use the left arrow key
- Use the right arrow key
As you move:
- The cursor follows the function graph
- x-values change incrementally
- y-values update automatically
This allows precise reading of graph points.
Step 5: Adjust Graph Window (If Needed)
If coordinate values change too quickly:
- Press WINDOW
- Adjust Xmin, Xmax, Ymin, and Ymax
- Press GRAPH again
Smaller ranges improve trace accuracy.
Step 6: Trace Multiple Functions (Optional)
If more than one equation is active:
- Use arrow keys to switch between functions
- Confirm which function graph is being traced
Deactivate unused equations if necessary.
Common Mistakes and How to Fix Them
• No cursor appears
- Cause: Graph not displayed correctly
- Fix: Reset graph window using standard zoom
• Values jump in large increments
- Cause: Graph window scale too wide
- Fix: Narrow the viewing range
• Tracing wrong function
- Cause: Multiple equations active
- Fix: Turn off unused equations in Y= screen
• Incorrect coordinate interpretation
- Cause: Confusing x and y values
- Fix: Always read values carefully from bottom display
Using the Online TI-84 Tool
You can practice graph tracing using the TI 84 Calculator Tool available on this website.
The online version allows you to:
- Enter functions
- Plot graphs instantly
- Activate trace mode
- Read precise coordinate values
This is helpful for homework practice and classroom demonstrations without a physical device.
Learning how to trace graphs on a TI 84 calculator improves graph reading accuracy and reduces estimation errors. The trace feature allows students to read exact x and y values directly from the function graph. Most issues occur due to incorrect graph window settings or multiple active equations.
By entering the function correctly, displaying the graph, activating the trace feature, and adjusting the viewing range when needed, students can confidently analyze coordinate values using their TI 84 graphing calculator.
- How to Graph Linear Functions on TI 84 Calculator
- How to Graph Quadratic Functions on TI 84 Calculator
- How to Adjust Graph Window on TI 84 Calculator
Yes. The trace feature works for linear, quadratic, and other functions.
Yes. It helps verify intercepts and analyze graph behavior accurately.
Tracing means moving a cursor along a function graph to read exact coordinate values.
This usually happens because the graph window range is too large.